Pulse Board Documentation
Complete guide to help you get started and make the most of Pulse Board
Introduction
Pulse Board is a powerful visualization tool that helps you understand your Jira projects better. It provides timeline views, risk analysis, and comprehensive analytics to keep your team on track.
Sign In to Pulse Board
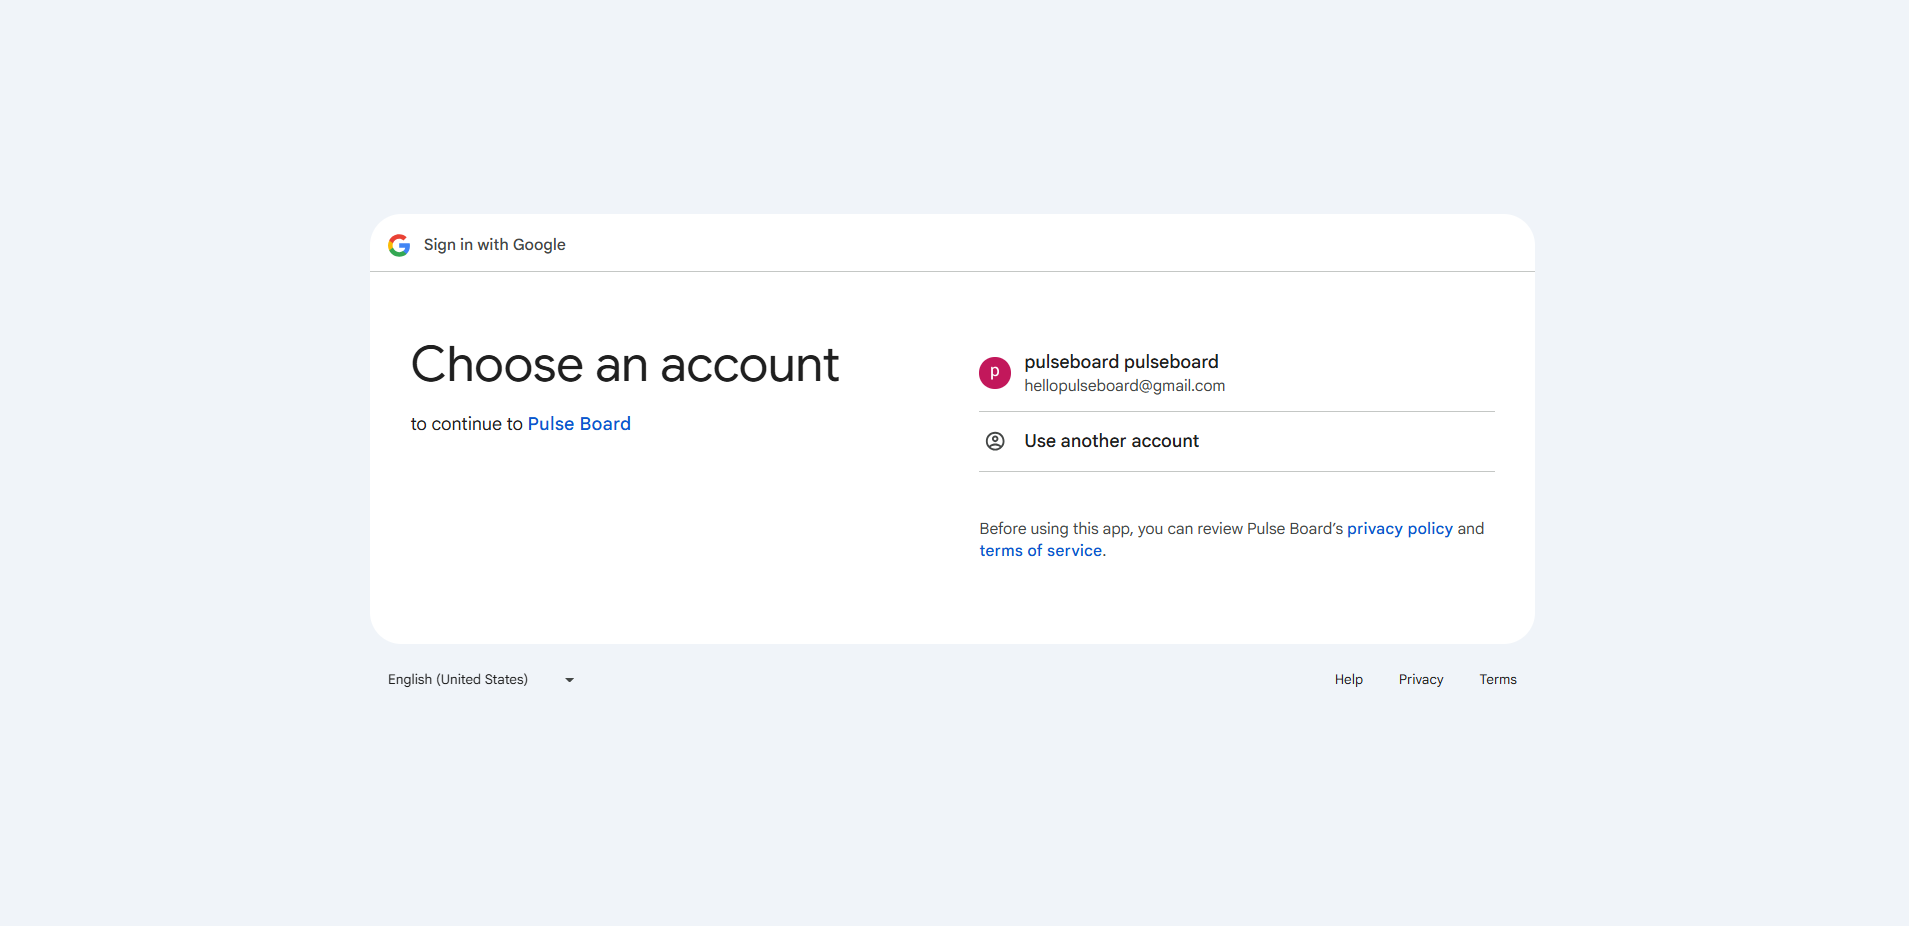
Authentication with Google
Pulse Board uses Google OAuth for secure authentication. Simply click the "Sign in with Google" button on the home page to get started.
Screenshot: Sign In Process
What happens when you sign in:
- Your Google account is used for authentication only
- No access to your Google data is requested
- Your Jira credentials are encrypted and stored securely in your browser
- You'll be redirected to the Settings page to configure your Jira connection
Security & Privacy
Your Jira credentials are never sent to our servers. They are encrypted and stored locally in your browser using industry-standard encryption. Only you have access to your data.
Getting Started
Quick Start Guide
Once you've signed in and connected to Jira, you're ready to start using Pulse Board. Here's what you can do next:
- Select a project from the project selector to view its data
- Explore the Timeline view to see issue progression
- Check the Board view for workflow status
- Review Analytics for project insights
- Monitor Risk indicators for potential blockers
Pro Tip
Use the filters at the top of each page to narrow down your view by assignee, issue type, status, or risk level. This helps you focus on what matters most to you and your team.
Setup & Configuration
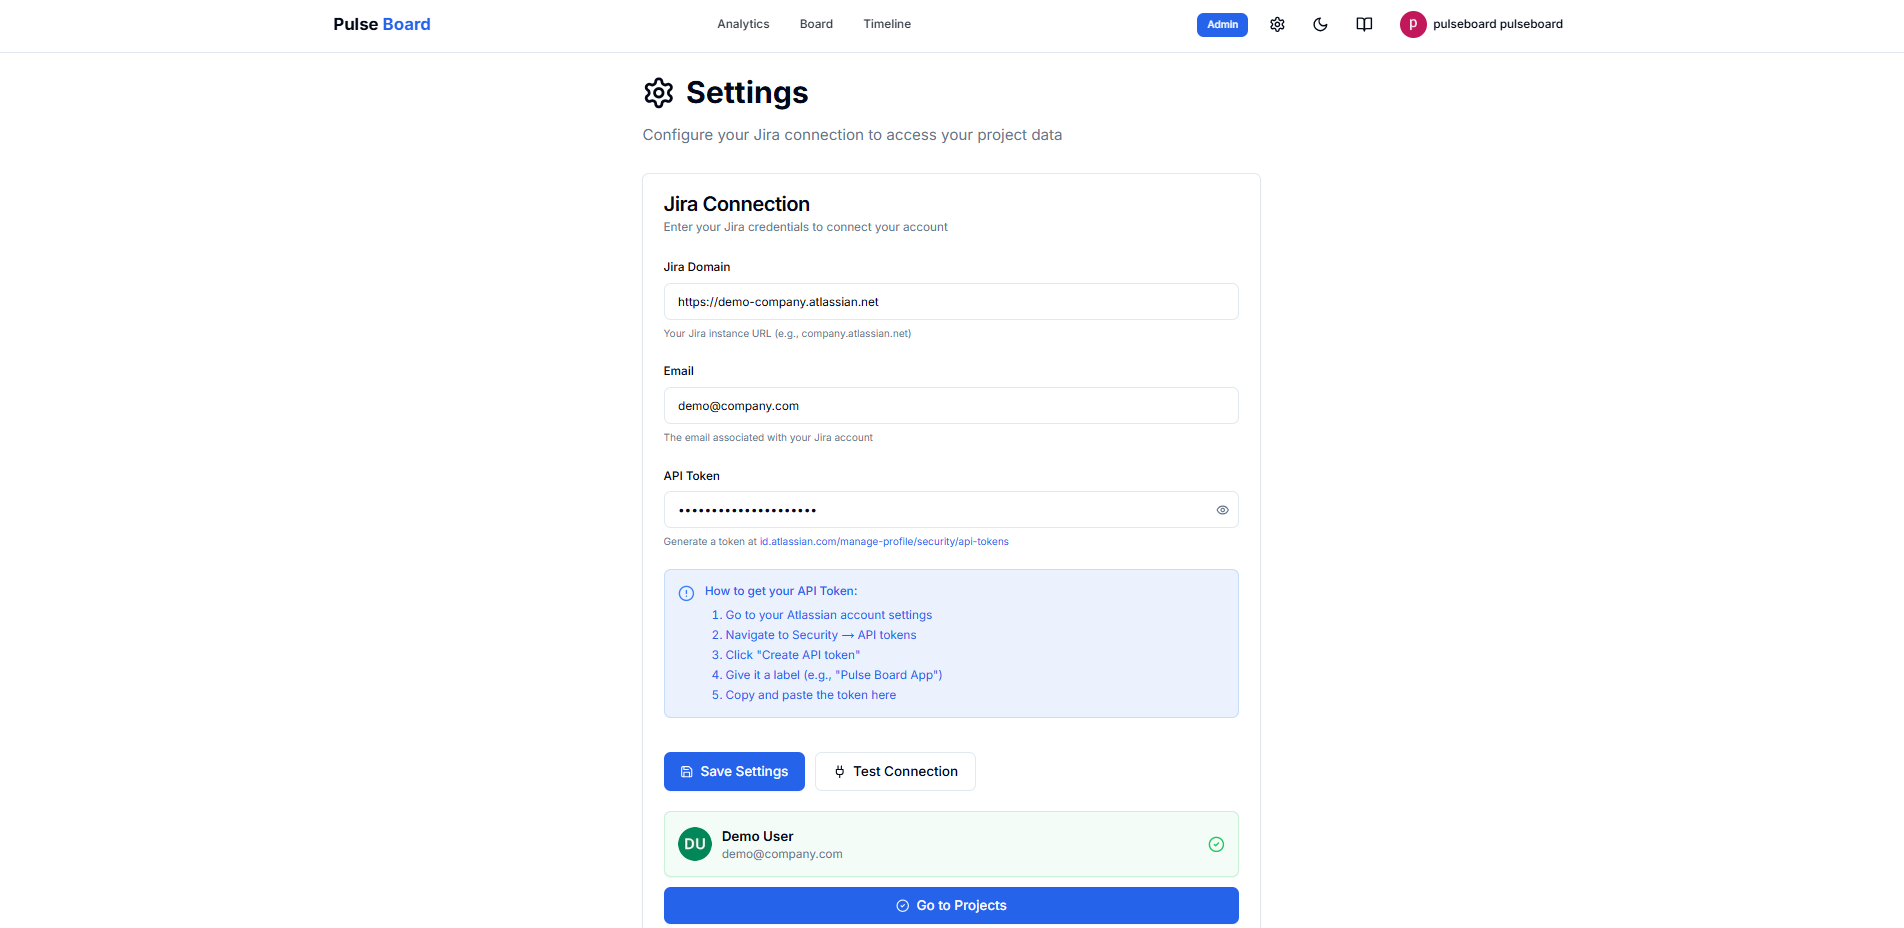
1. Connect to Jira
Navigate to Settings and configure your Jira connection with your instance URL, email, and API token.
Screenshot: Jira Configuration
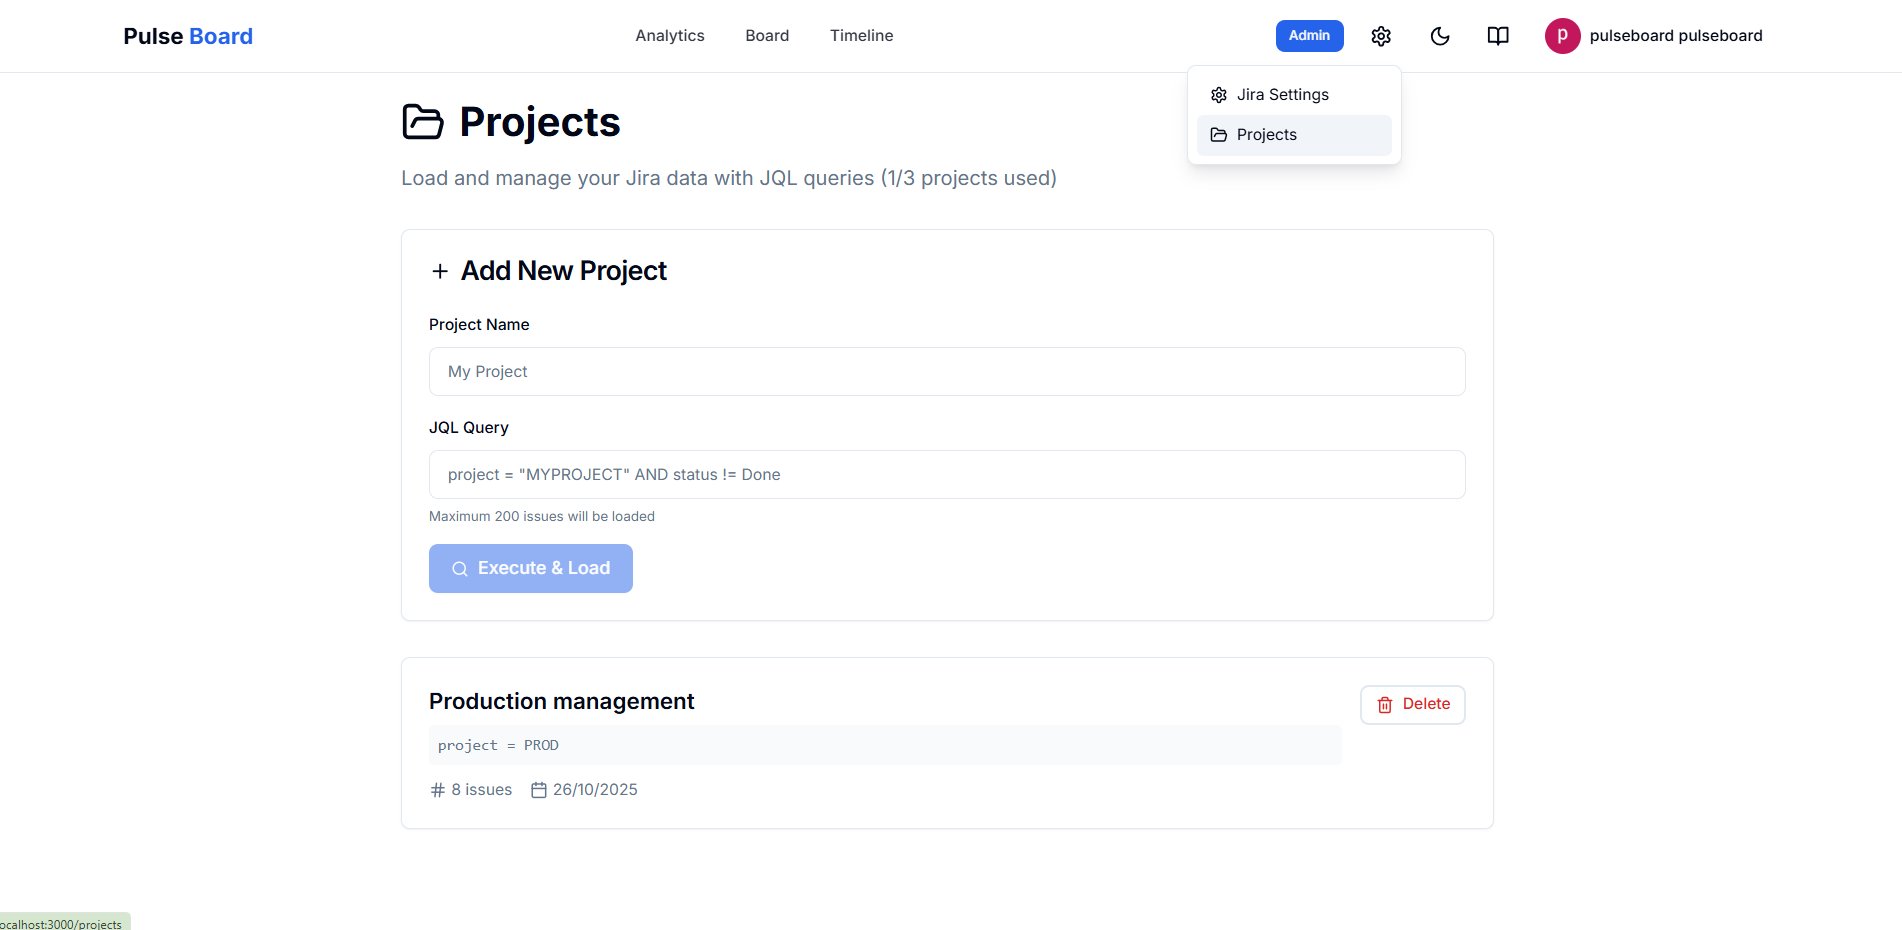
2. Create a Project
Create a new project by entering a name and JQL query to fetch your Jira issues.
Screenshot: Create Project
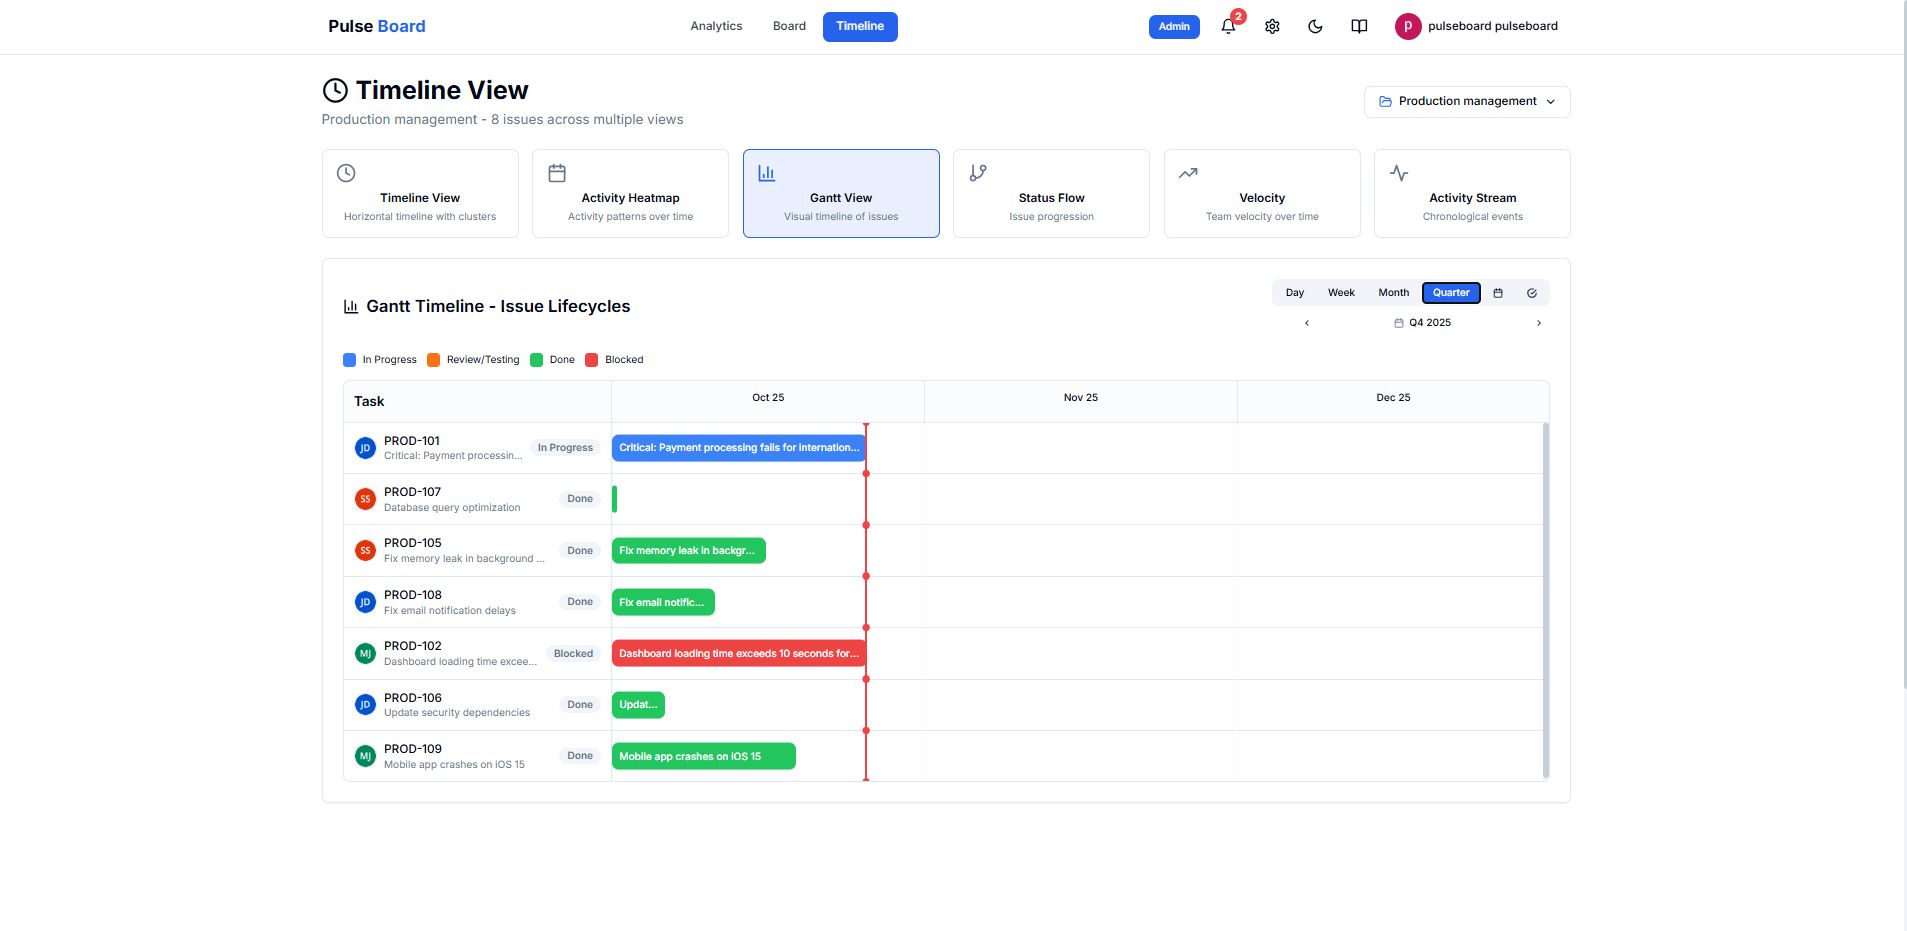
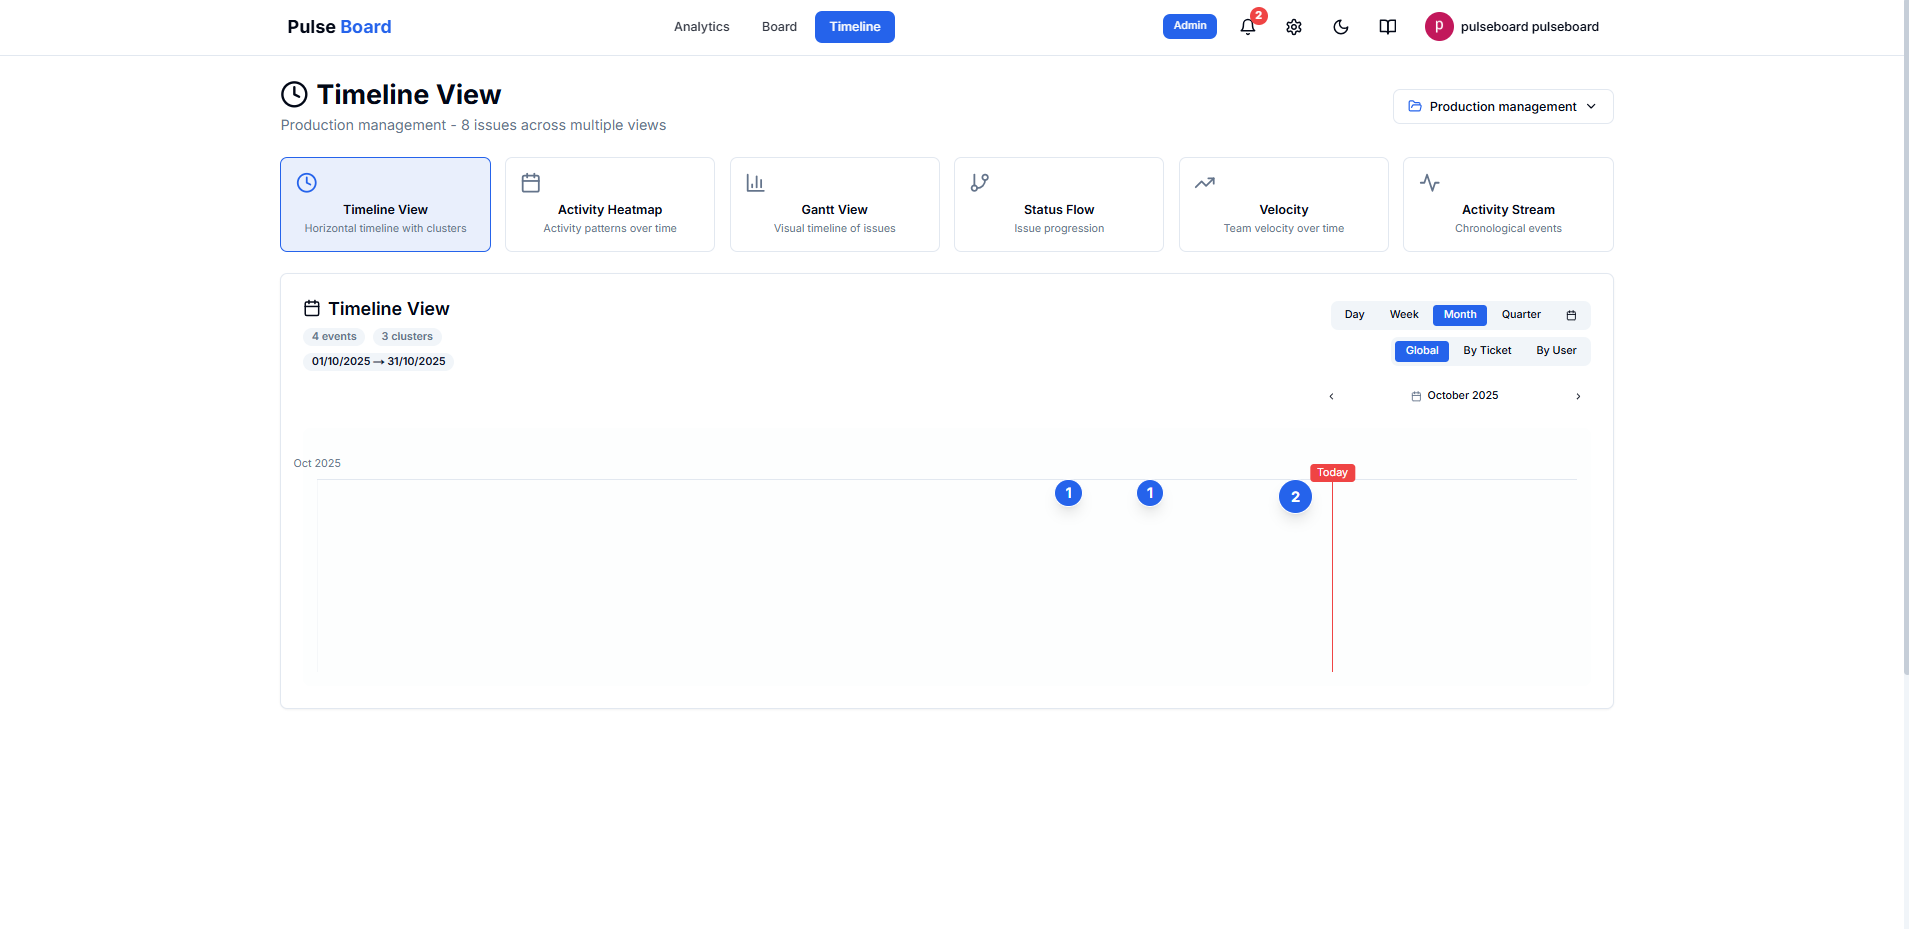
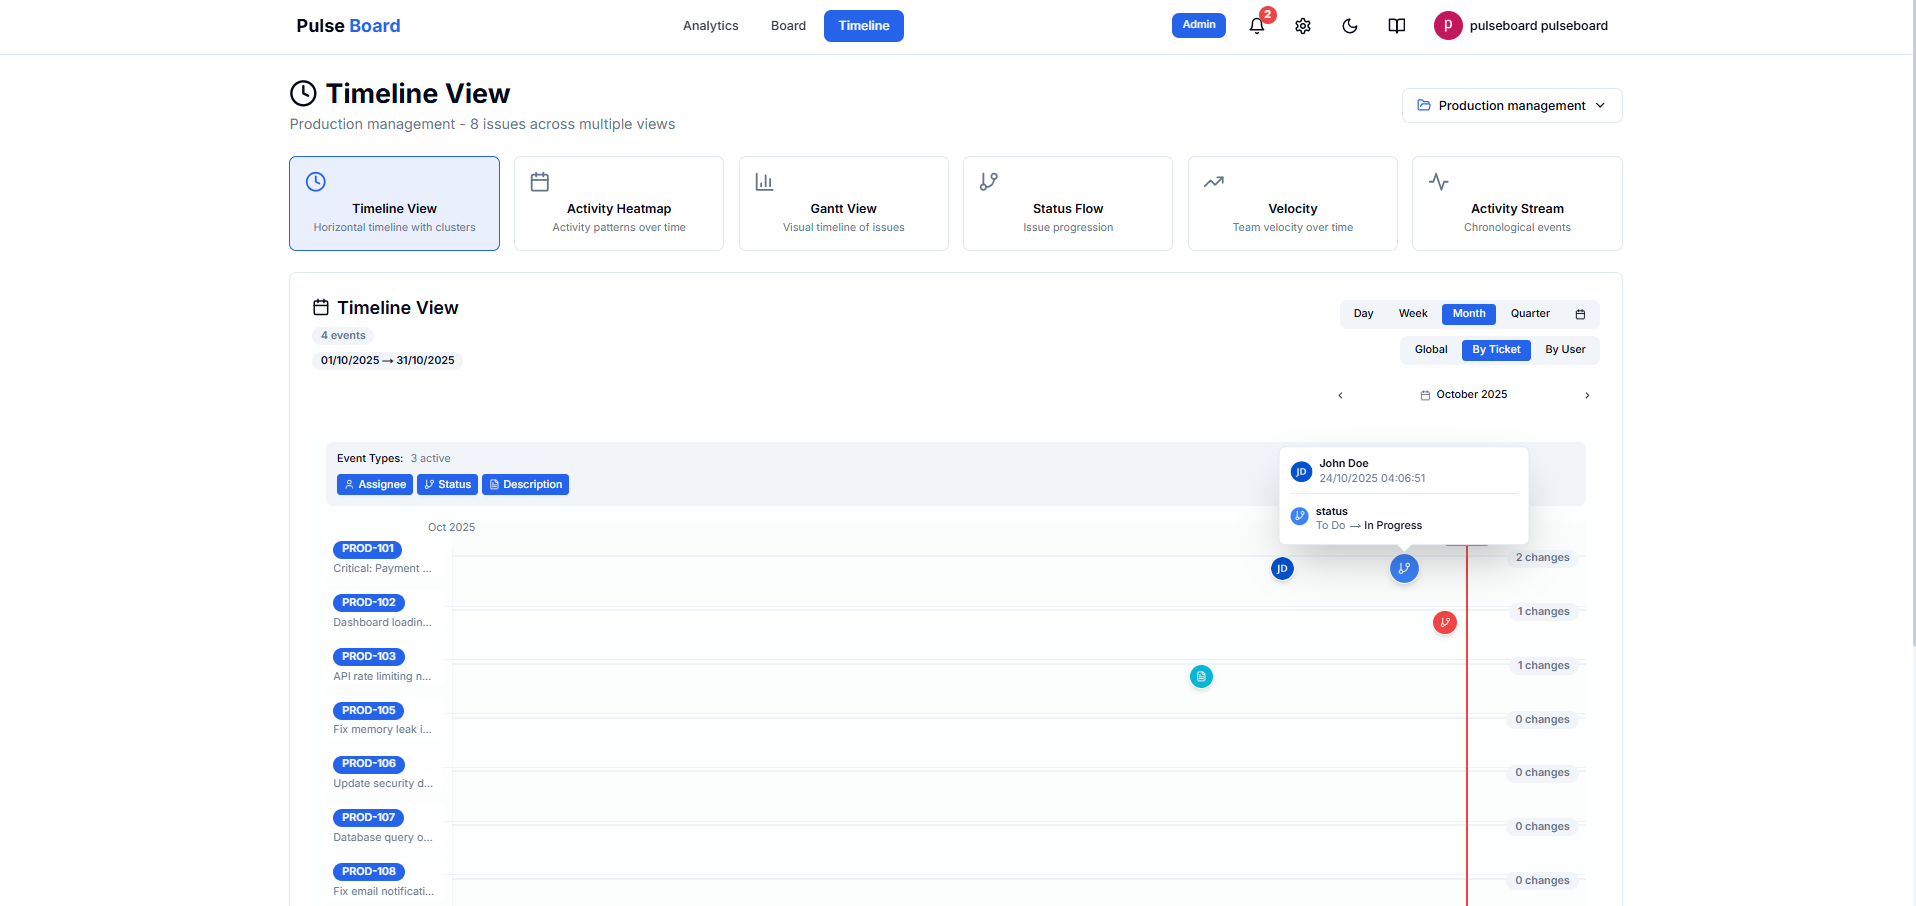
Timeline View
The Timeline view shows your issues on a horizontal timeline, making it easy to see when work started and how long it has been in progress.
1. Timeline Overview
Screenshot: Timeline Page
2. Timeline Filters
Screenshot: Timeline Filters
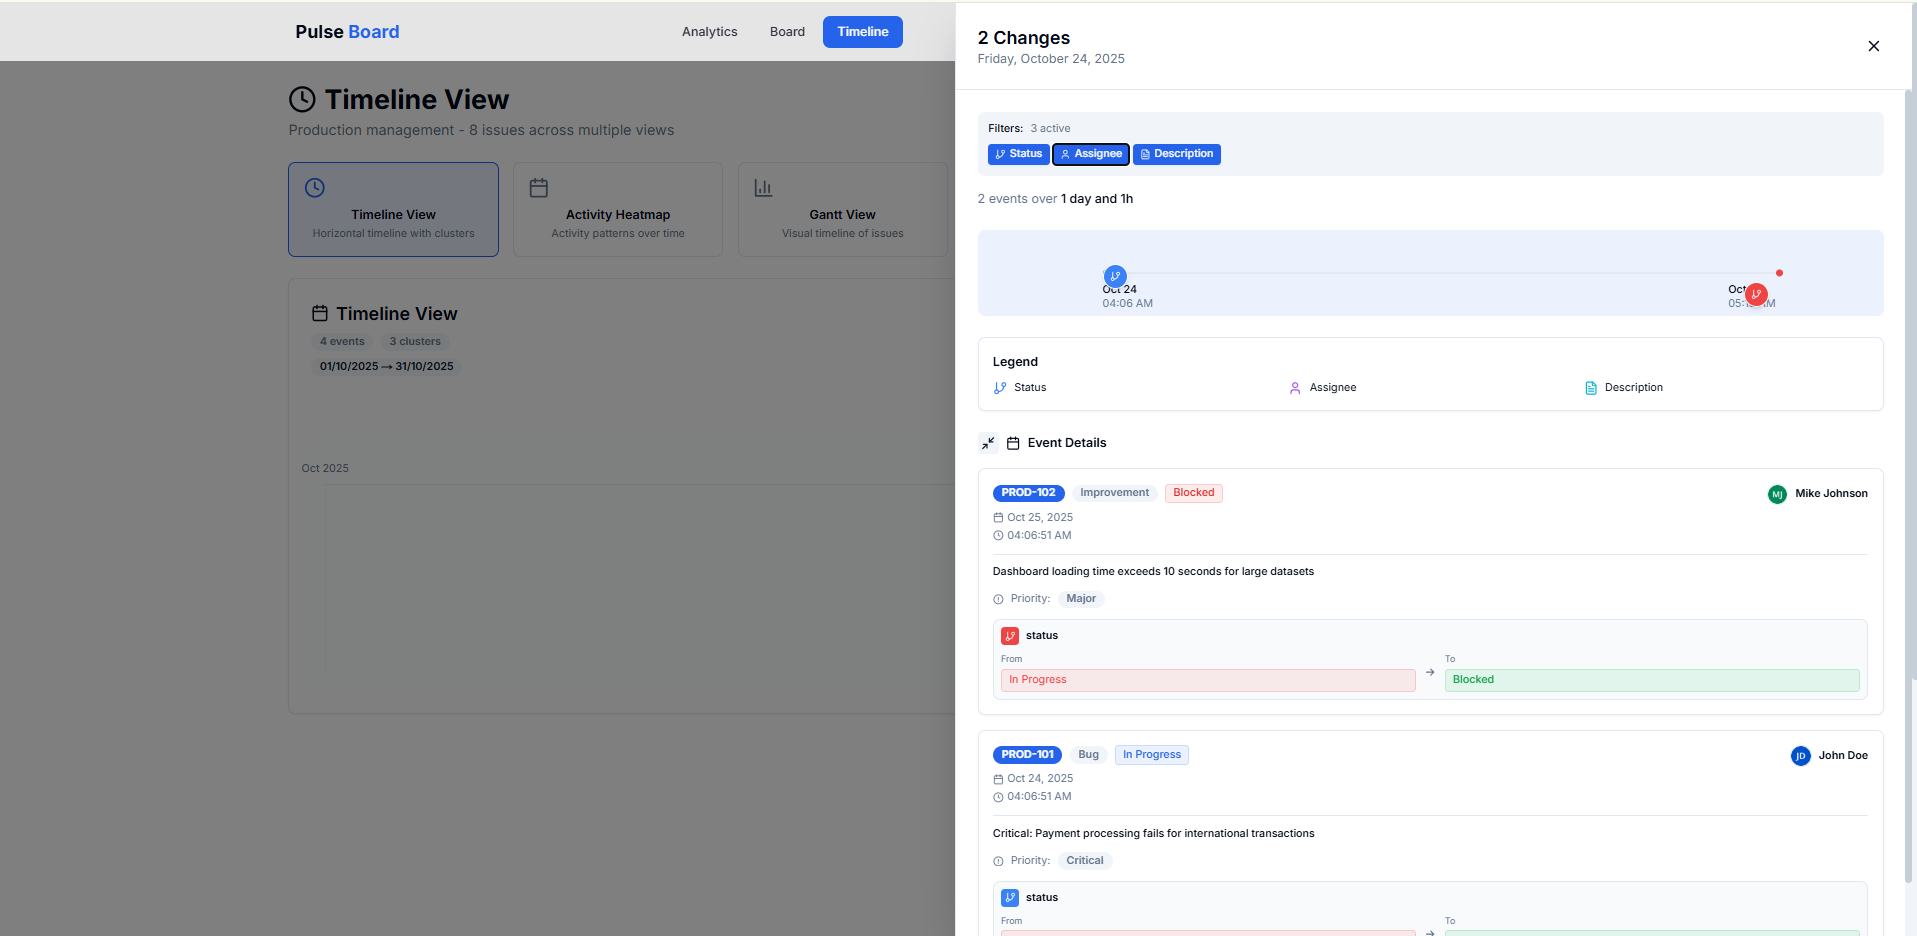
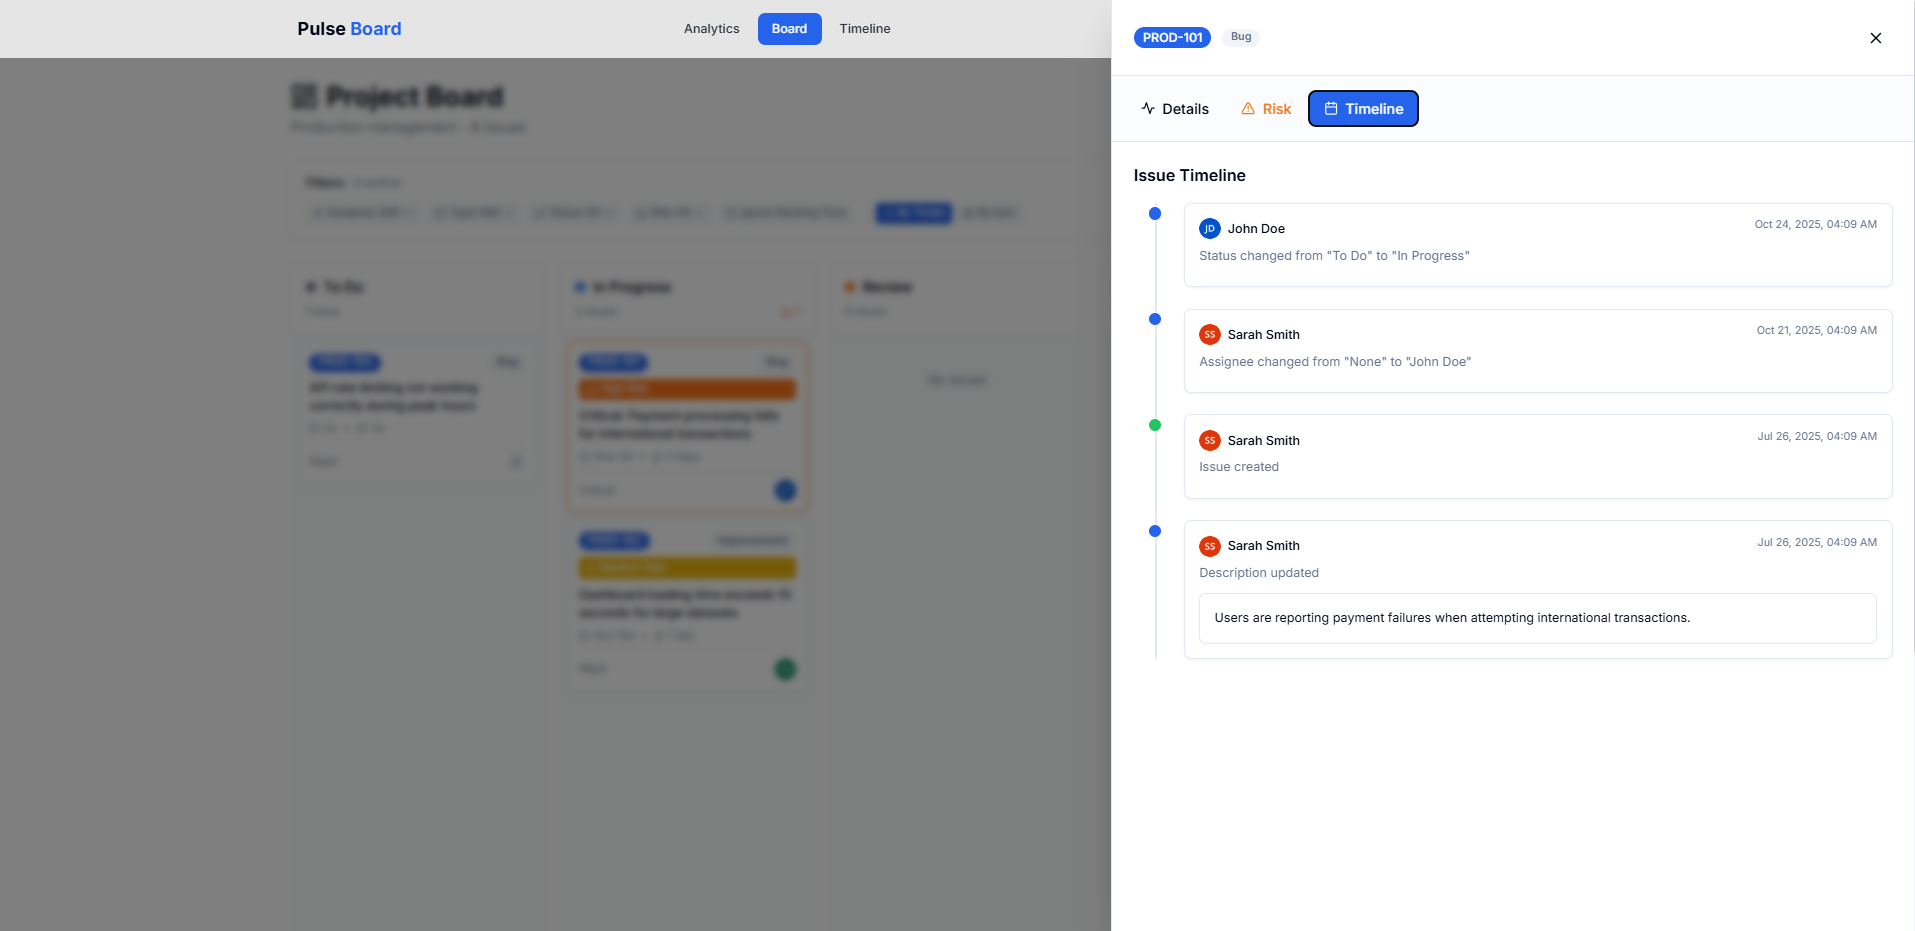
3. Issue Details on Timeline
Screenshot: Timeline Event Details
Key Features:
- Horizontal scrolling timeline
- Color-coded by risk level
- Click any issue to see detailed information
- Filter by assignee, type, status, and risk
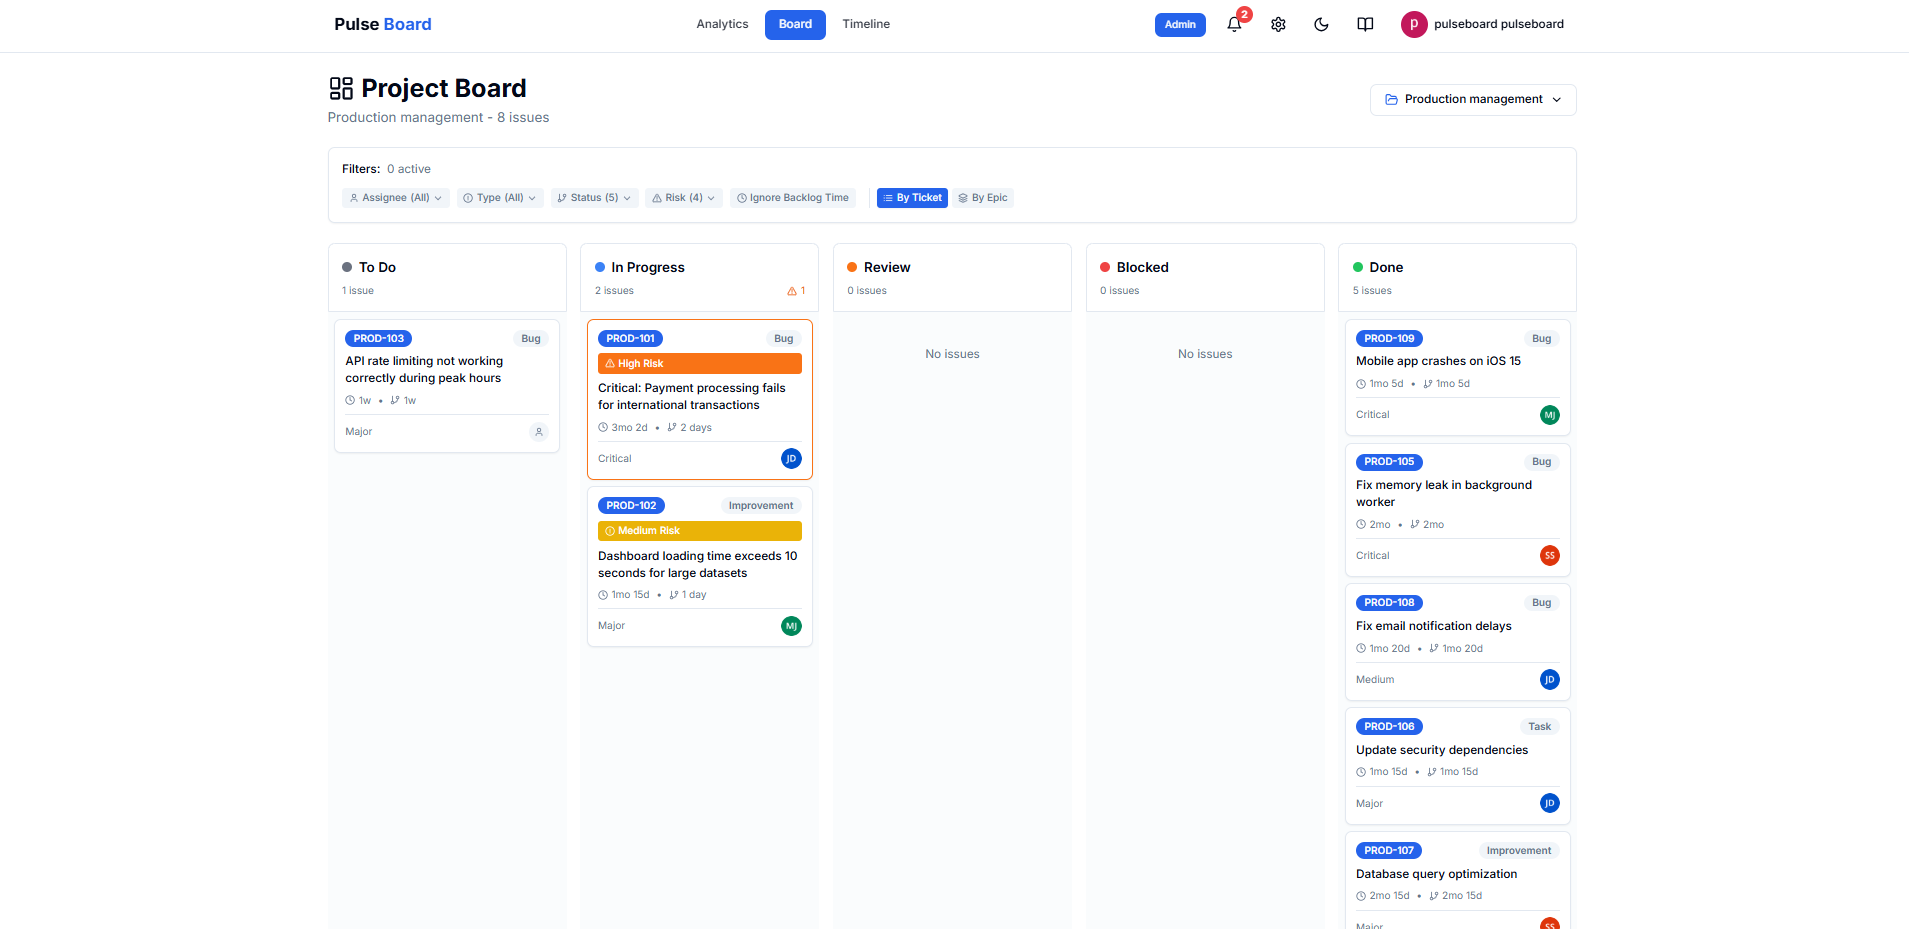
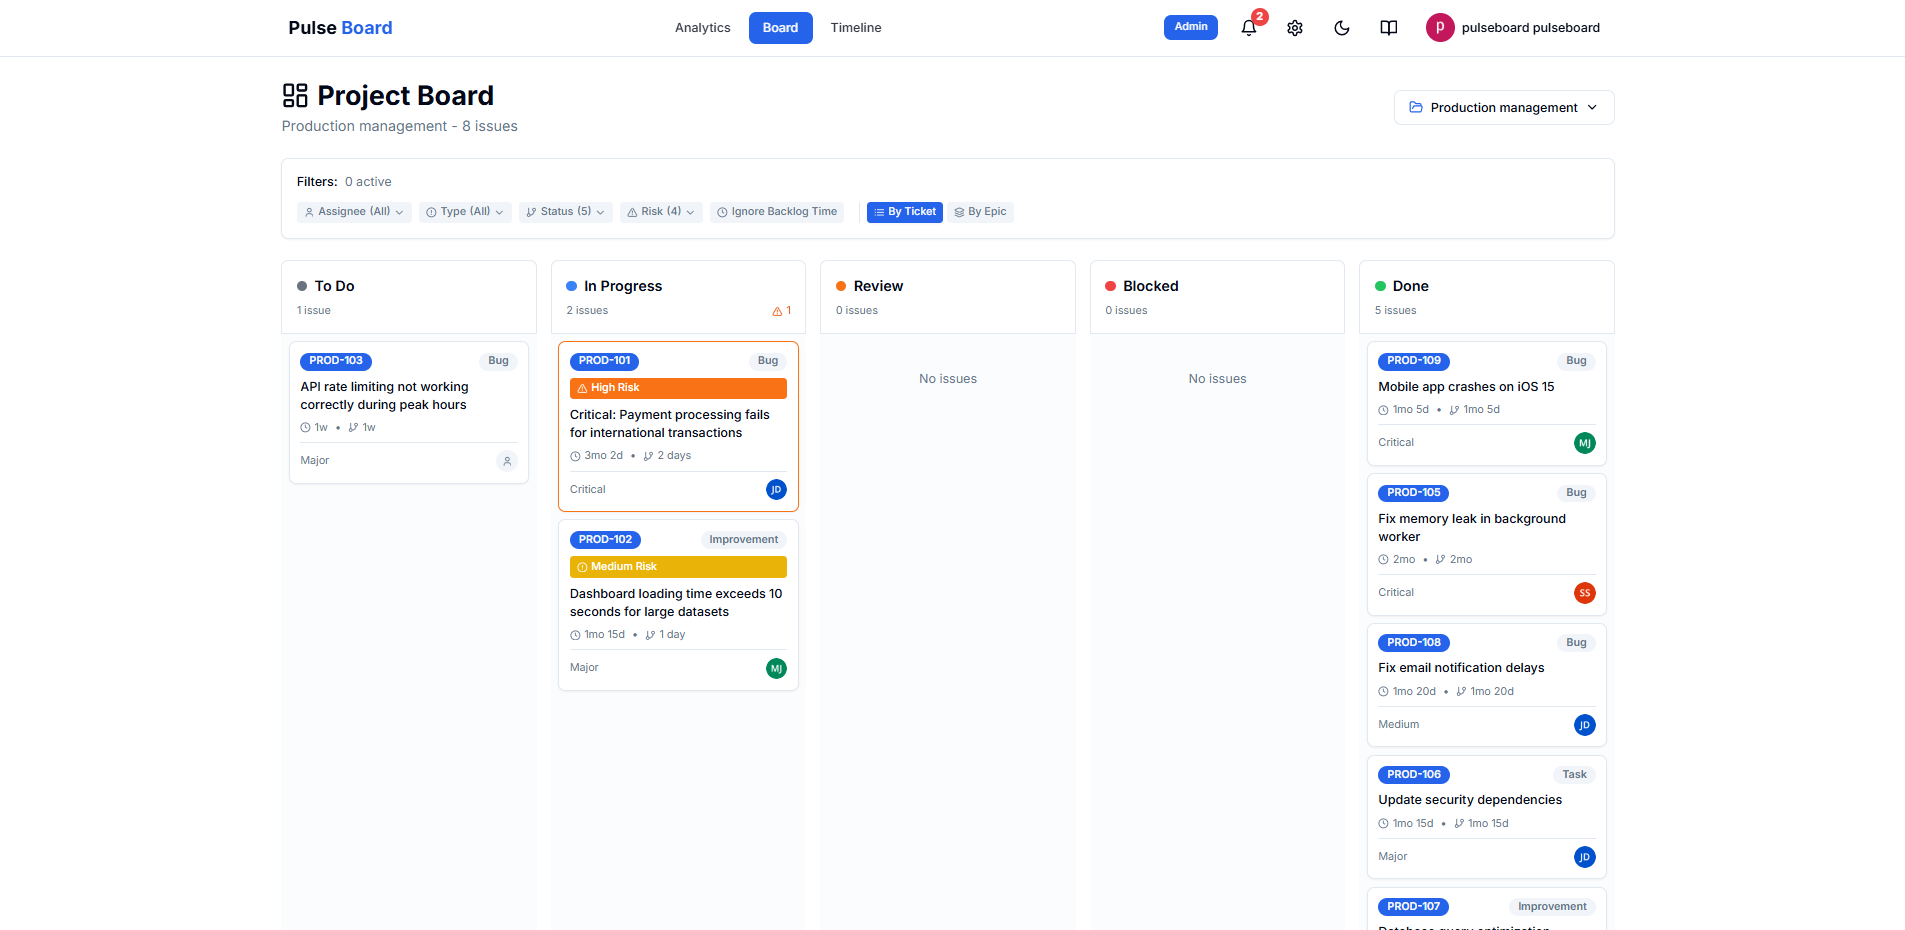
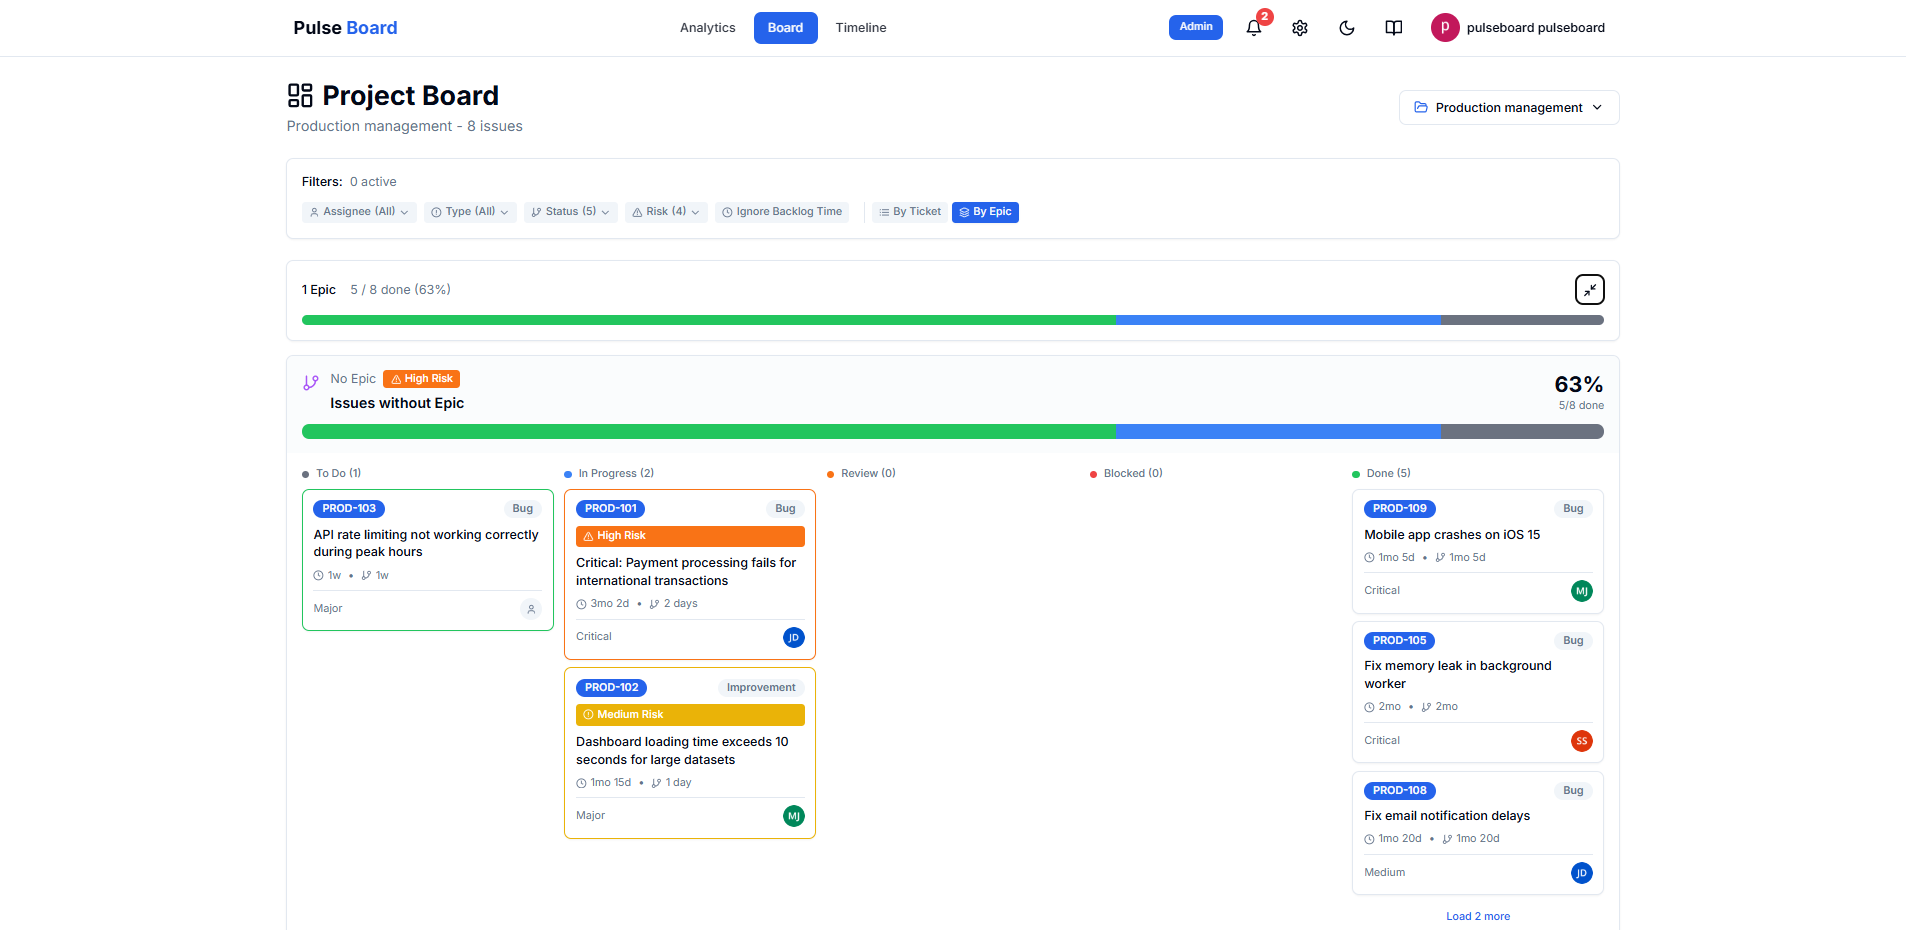
Board View
The Board view organizes your issues in columns by status, similar to a Kanban board.
1. Board Overview
Screenshot: Board Page
2. Board Filters & Views
Screenshot: Board Filters
3. Issue Side Panel
Screenshot: Board Issue Details
View Options:
- By Ticket: View individual issues sorted by risk
- By Epic: Group issues under their epics
- Load more issues with the "Load more" button
- Issues are automatically sorted by risk (High → Low)
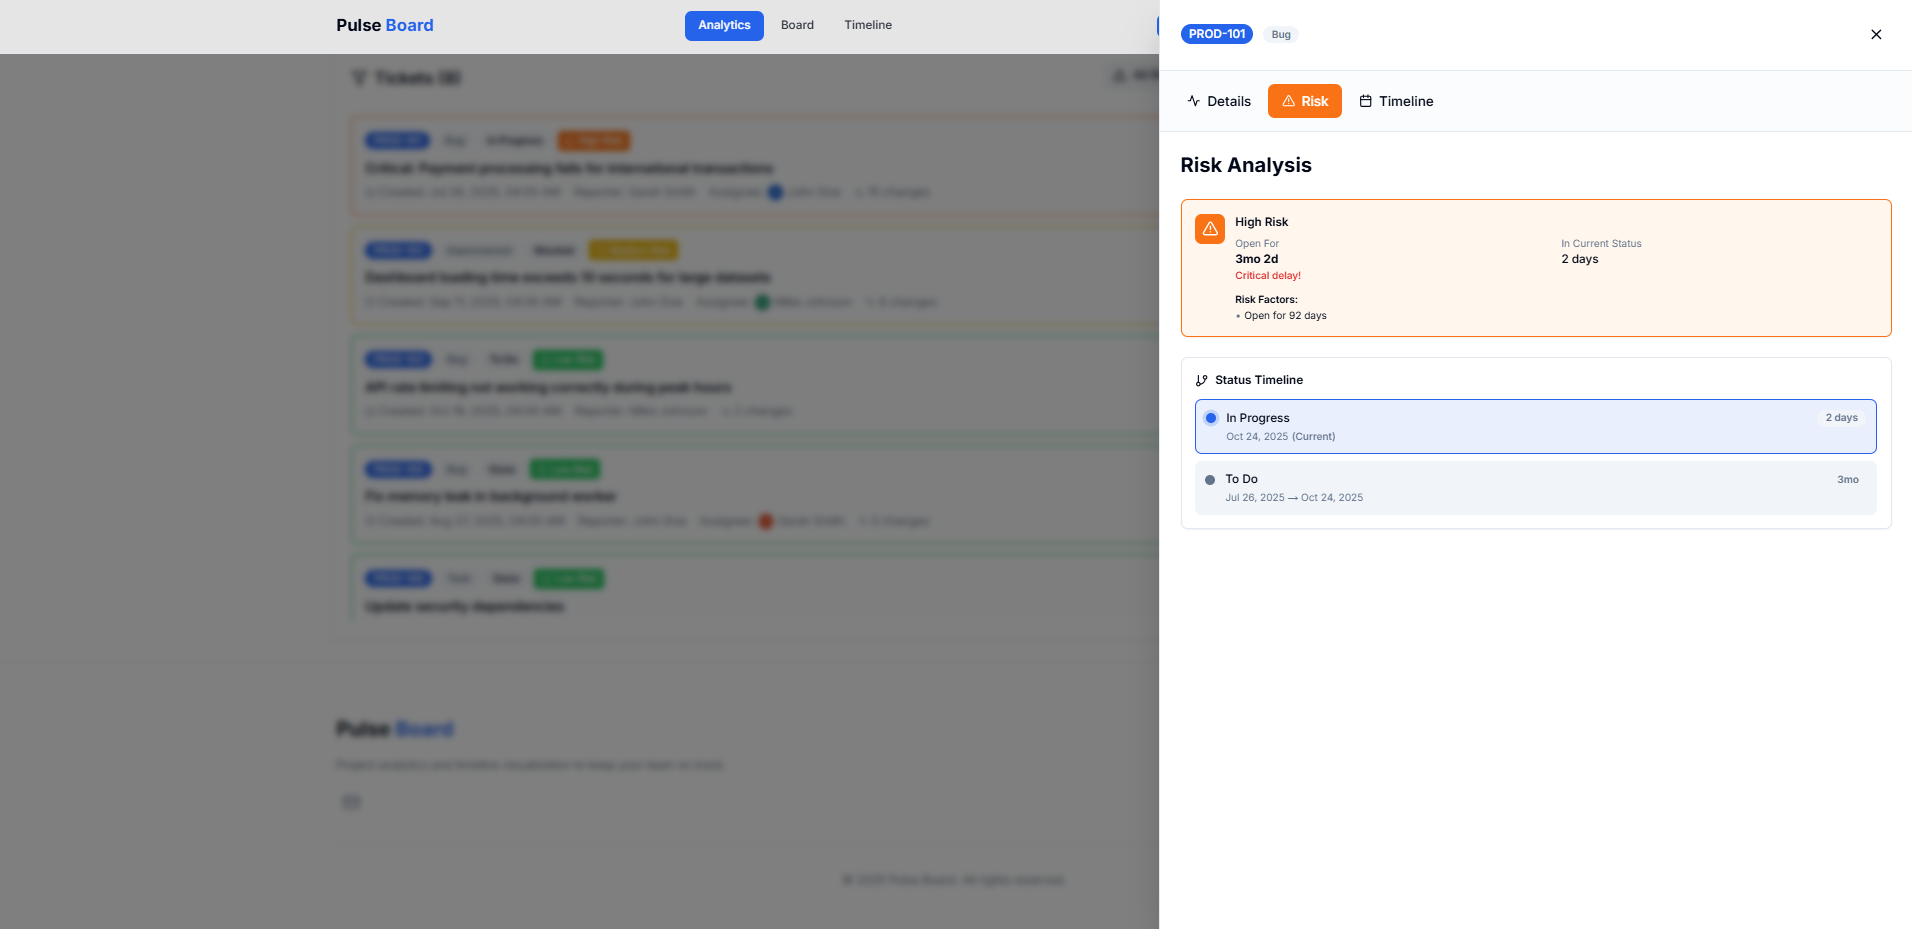
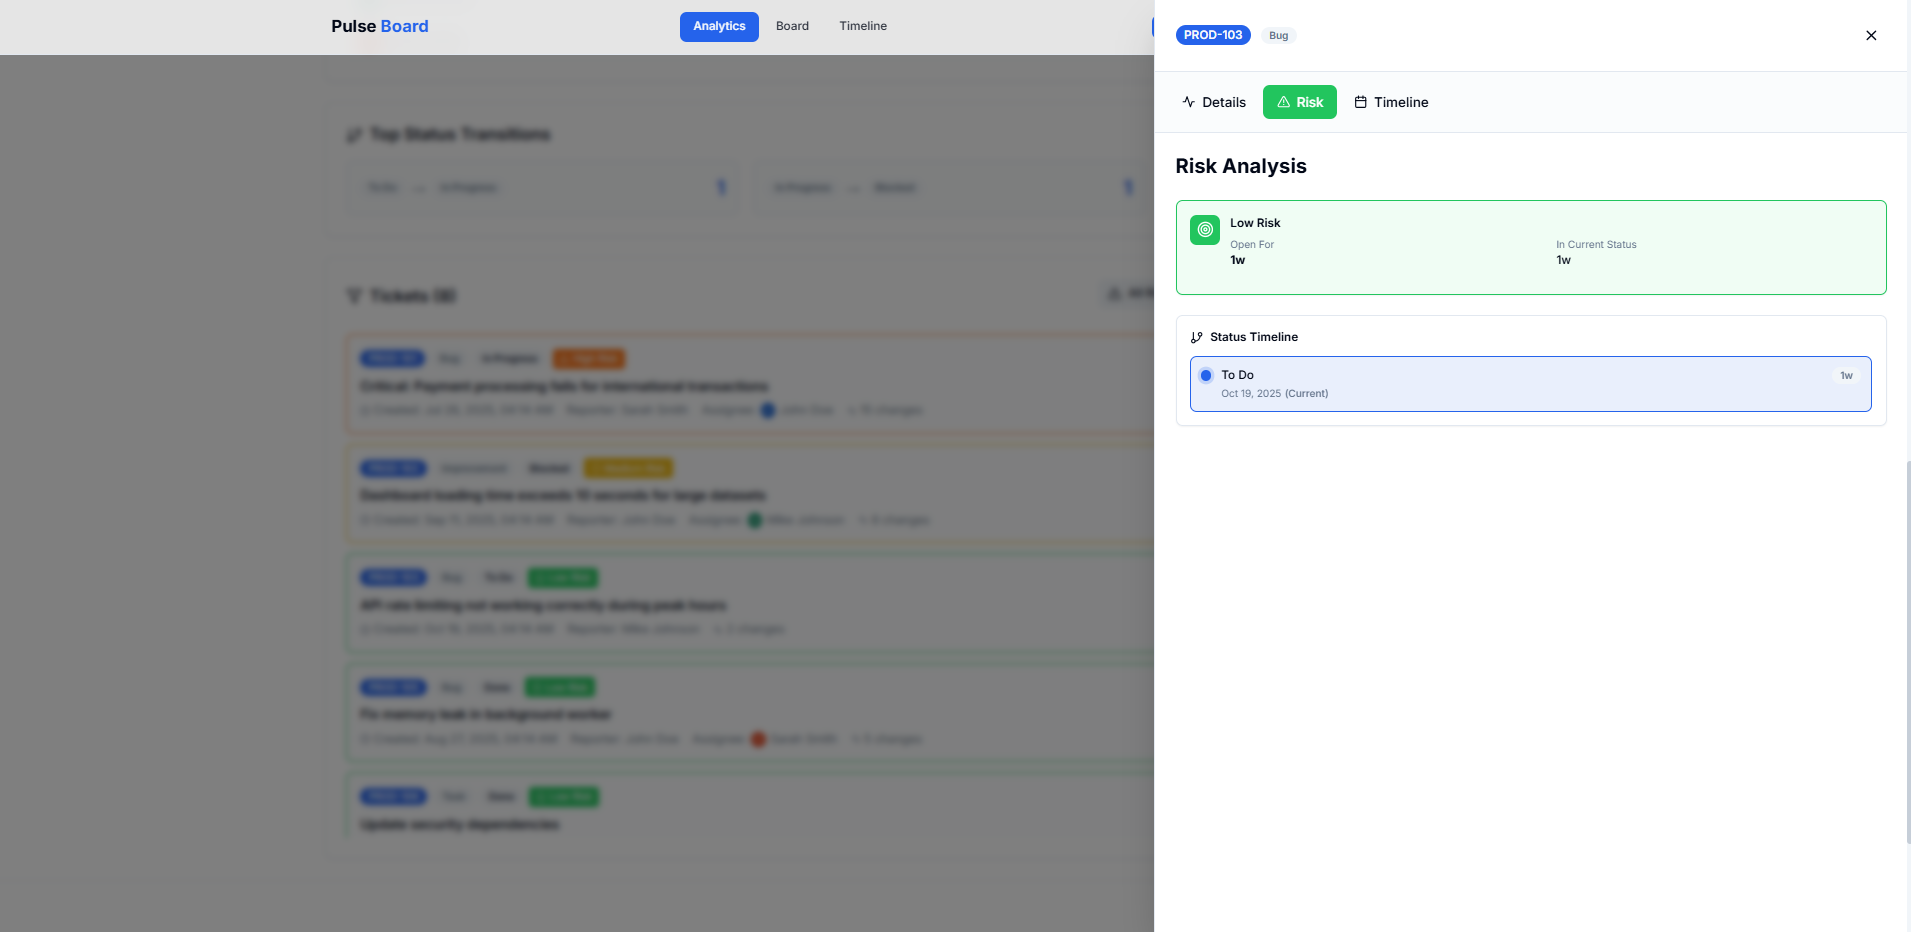
Risk Analysis
Pulse Board automatically analyzes your issues to identify potential blockers and delays.
Screenshot: Risk Panel
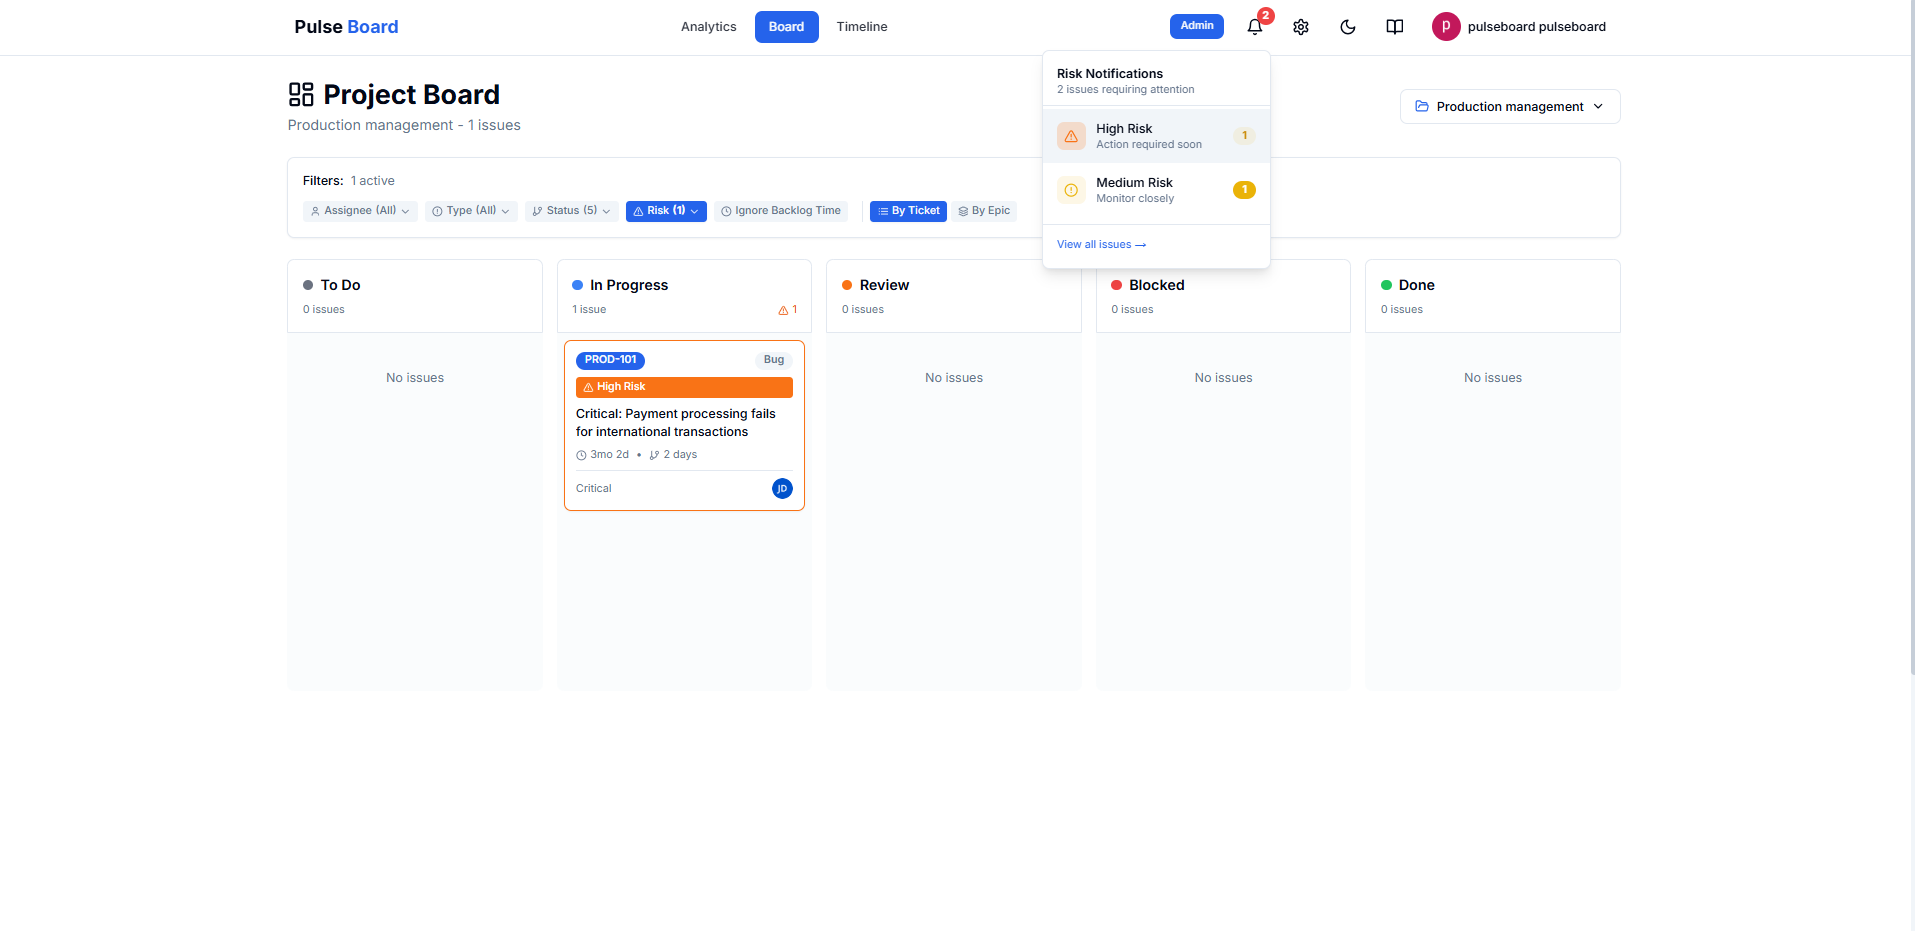
Risk Levels:
Issues open for over 60 days or stuck in review
Issues open for 30-60 days or in status for extended time
Issues open for 14-30 days
Recently opened issues (under 14 days)
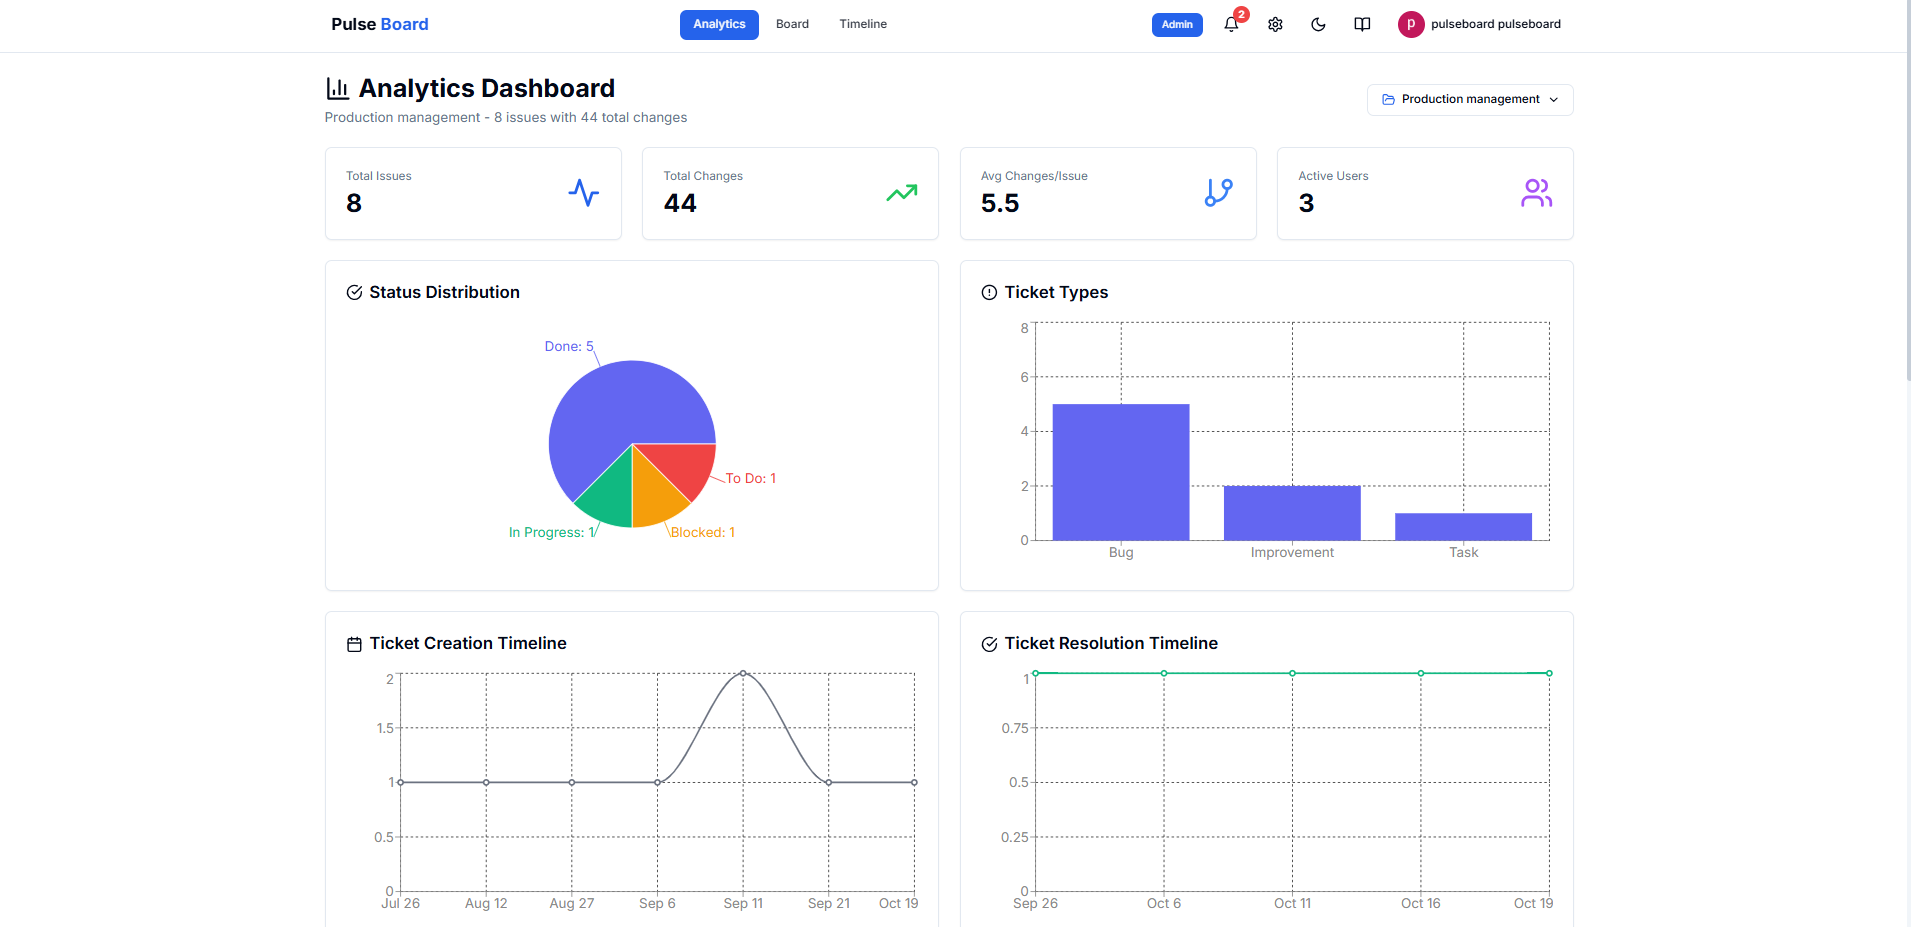
Analytics
Get insights into your project progress with detailed charts and metrics.
1. Analytics Overview
Screenshot: Analytics Page
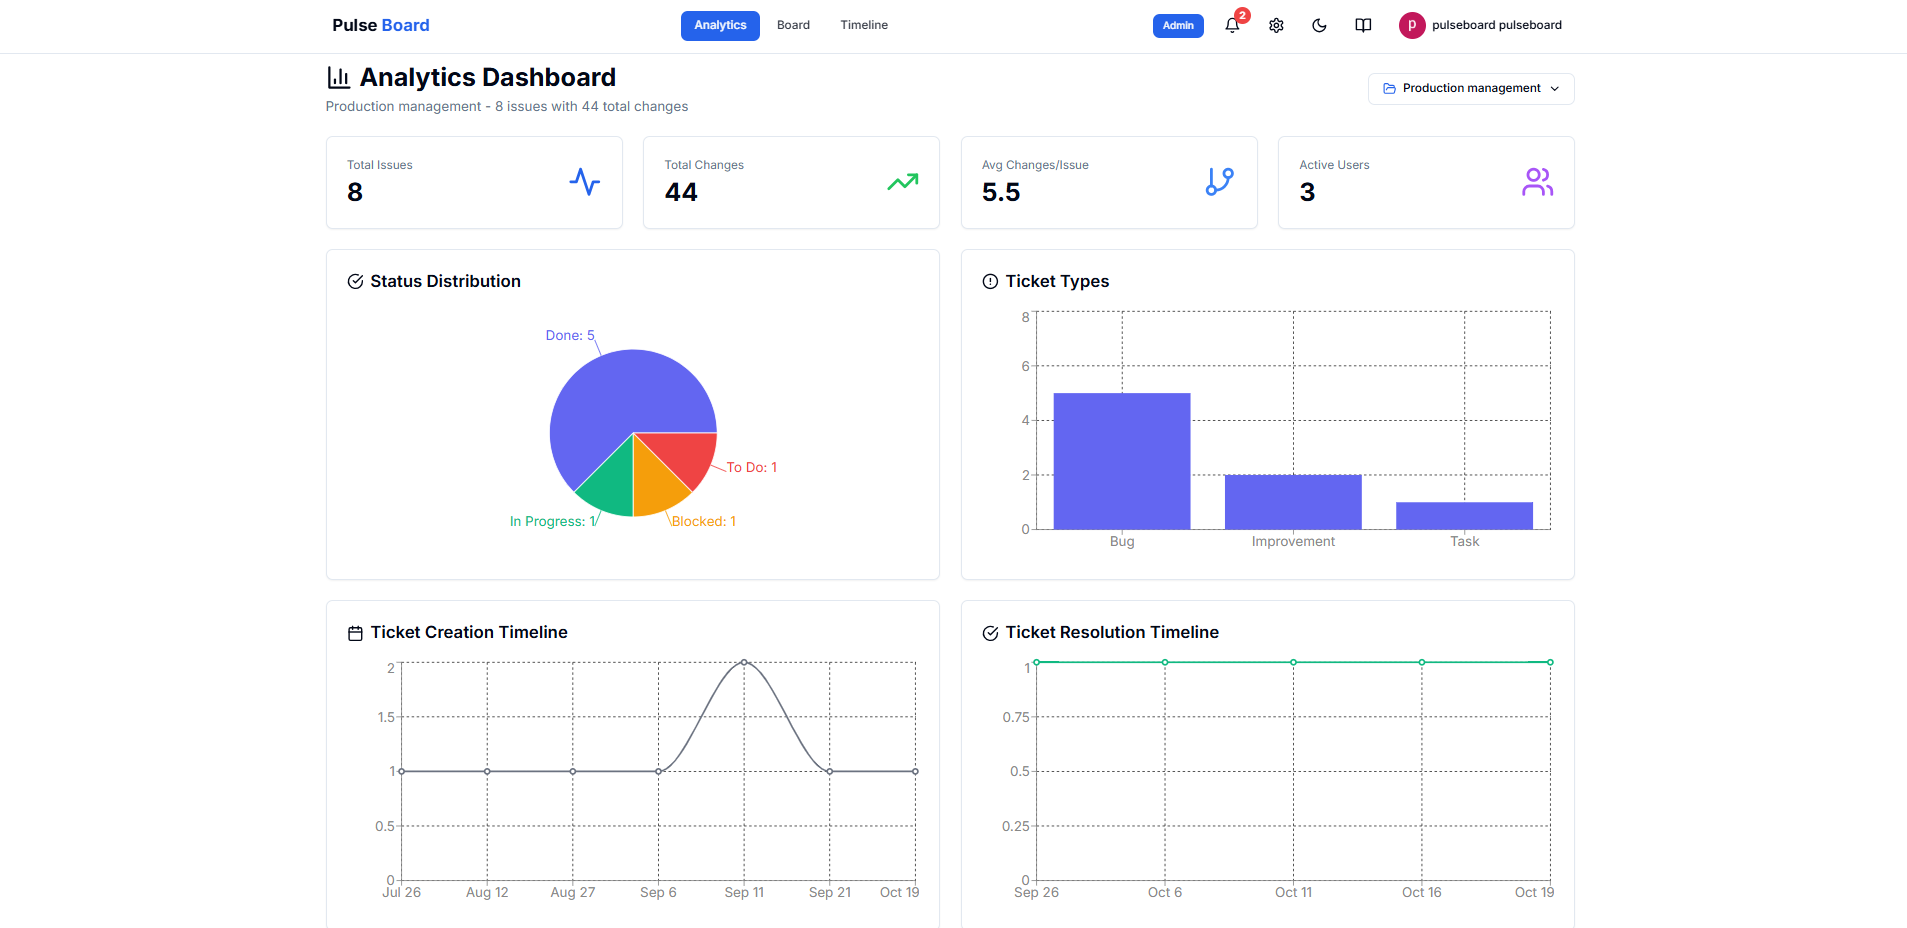
2. Analytics Charts
Screenshot: Analytics Charts Detail
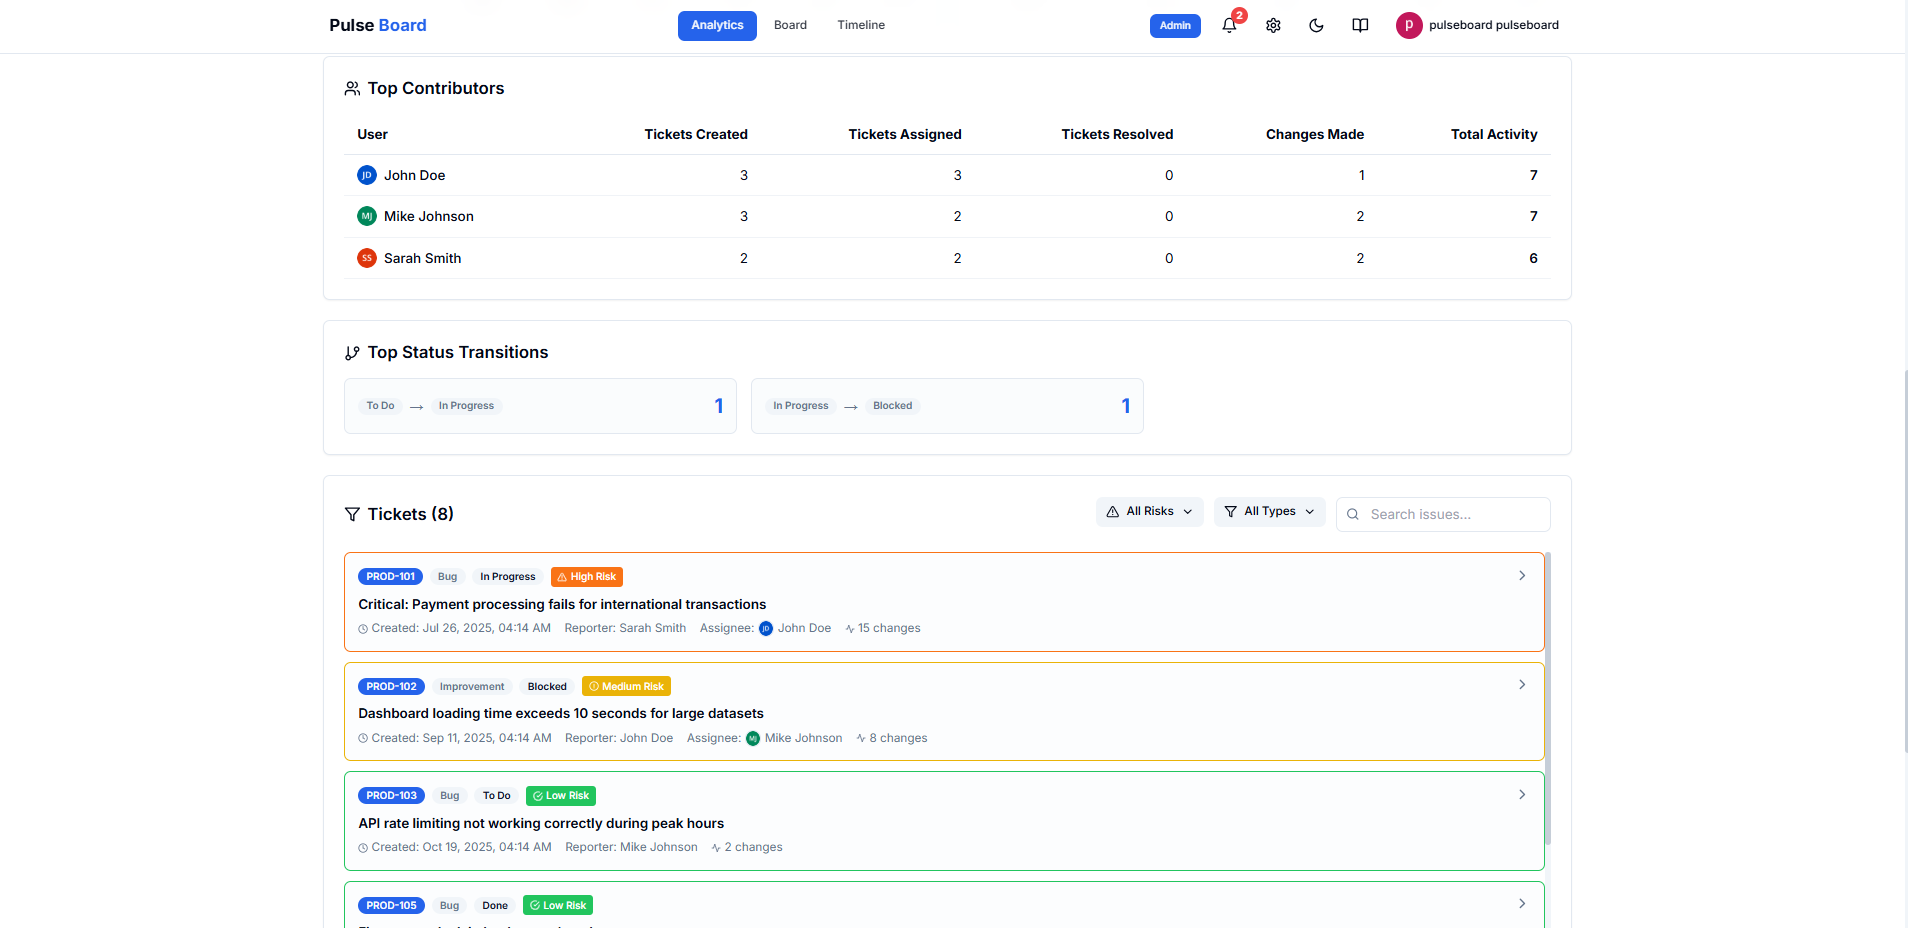
3. Issue List with Risk Filter
Screenshot: Analytics Issue List
Key Metrics:
- Issues created and resolved over time
- Status distribution
- Priority breakdown
- Team member activity
- Filter by risk level, type, and search by keyword
Filters & Search
Use filters to focus on specific issues and find what you need quickly.
Interactive Demo: Filter Usage
Available Filters:
- Assignee: Filter by who is working on the issue
- Type: Bug, Task, Story, etc.
- Status: To Do, In Progress, Done, etc.
- Risk: Critical, High, Medium, Low
- Backlog Time: Optionally exclude time spent in backlog from risk calculation
Tips & Tricks
Keyboard Shortcuts
Press ESC to close any open panel or modal
Dark Mode
Toggle between light and dark themes using the sun/moon icon in the header
Open in Jira
Click "Open in Jira" button in the issue details panel to view the issue in Jira directly
Risk Notification Badge
The notification badge in the header shows how many high-risk issues need attention
Need more help? Check your Jira connection settings or contact support.